


The Magnificent 4 of Economic Data
The Magnificent 4 of economic data: #1 Total employment #2 Industrial Production #3 Personal Income #4 Retail Sales If the current labor trends in the U.S. persist, leading to continued job creation


Investors are buzzing about the so-called "Magnificent 7" stocks - a group dominating the S&P 500's performance. This elite list includes Microsoft, Apple, Google, Amazon, Nvidia, Tesla, and Meta. I'm convinced that the supportive backdrop provided by the "Magnificent 4" economic indicators is playing a significant role in bolstering these companies, helping to dispel concerns about an imminent recession. If the current labor trends in the U.S. persist, leading to continued job creation, I foresee a recession-free 2024. This scenario could sustain the momentum for these firms, among others, for yet another year.
The Magnificent 4 of economic data:
#1 Total employment
#2 Industrial Production
#3 Personal Income
#4 Retail Sales
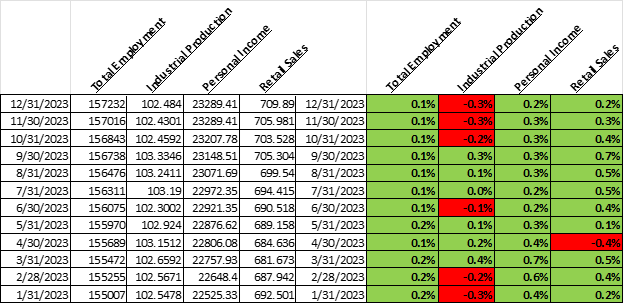
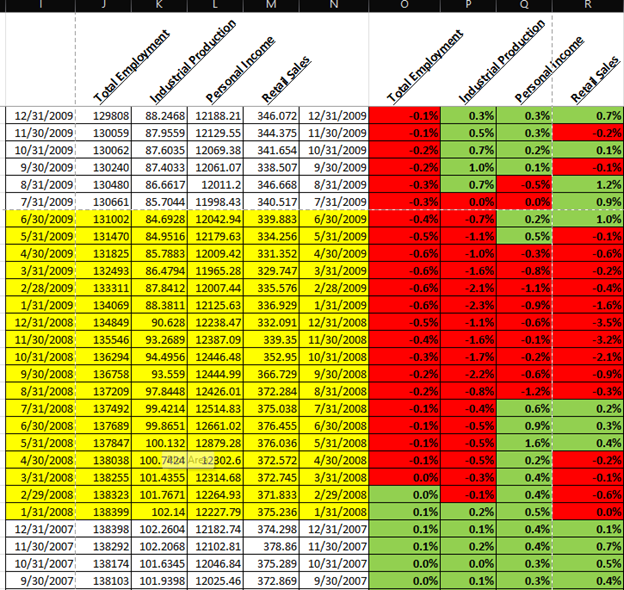
The left-hand columns in the above dataset display actual figures, while the right-hand columns highlight the month-to-month variation in three-month averages. A positive trend across all four data points indicates a robust momentum in employment, which typically leads to increased incomes. Higher incomes then boost consumption (demand), which in turn drives up production (supply). Currently the trend for three out of four is positive.
The National Bureau of Economic Research (NBER) in the U.S. characterizes a recession as "a substantial decrease in economic activity that spans the economy, enduring for more than two quarters (i.e., six months), and is usually evident in real GDP, real income, employment, industrial production, and wholesale-retail sales" (source: Wikipedia).
Post-World War II, the U.S. has not encountered a recession when the trend of the "Magnificent 4" is positive. Within this group, employment stands out as the most crucial factor, warranting the title "The Magnificent One". This concept draws inspiration from Claudia Sahm, a former Federal Reserve economist, who formulated the 'Sahm rule for recession' using a similar dataset. My approach aims to offer an even simpler alternative to the Sahm rule.
Here is more info on Sahm rule:

Fred database already created a dataset for the Sahm rule, which is also currently positive.
https://fred.stlouisfed.org/series/SAHMREALTIME
#1 Total employment in the U.S.
The non-farm employment report stands as the most crucial dataset coming from the U.S. It provides key insights into several aspects of the labor market, including the number of people earning wages, variations in wage levels, labor force participation, and the number of actively job-seeking unemployed individuals. The significance of this dataset is underscored by the fact that the U.S. has never undergone a recession without a decline in total employment. Released on the first Friday of each month, this report typically triggers notable price fluctuations across various markets, including foreign exchange, bonds, and equities.

In 2023, the U.S. economy surged ahead, adding 2.7 million jobs—an increase of 1.8%, while real wages saw a 0.8% increase (measured by the average hourly change and the Consumer Price Index). Notably, nearly 70% of the U.S. economy hinges on consumption, making it closely tied to overall employment and wage growth. Considering both factors, a ballpark estimate for U.S. GDP growth in 2023 stands at 2.6%, and the consensus expectation hovers at 2.4%.
Fast forward to 2024: The pivotal questions surrounds the creation of new jobs and the possibility of sustained wage growth. With approximately 9 million job openings and around 6 million job seekers, assuming the addition of 100k new jobs each month in 2024, coupled with a half-yearly real wage growth rate of 0.4% (half of 2023's figure) appears reasonable. This cumulative influx of 1.2 million new jobs signifies a 0.8% increase. Consequently, the ballpark estimate for GDP growth in 2024 would be around 1.2%, factoring in both changes in total employment and real wage growth. Interestingly, this aligns closely with the consensus GDP growth estimate for 2024, which stands at 1.3%, indicating a remarkable convergence with our approximation.
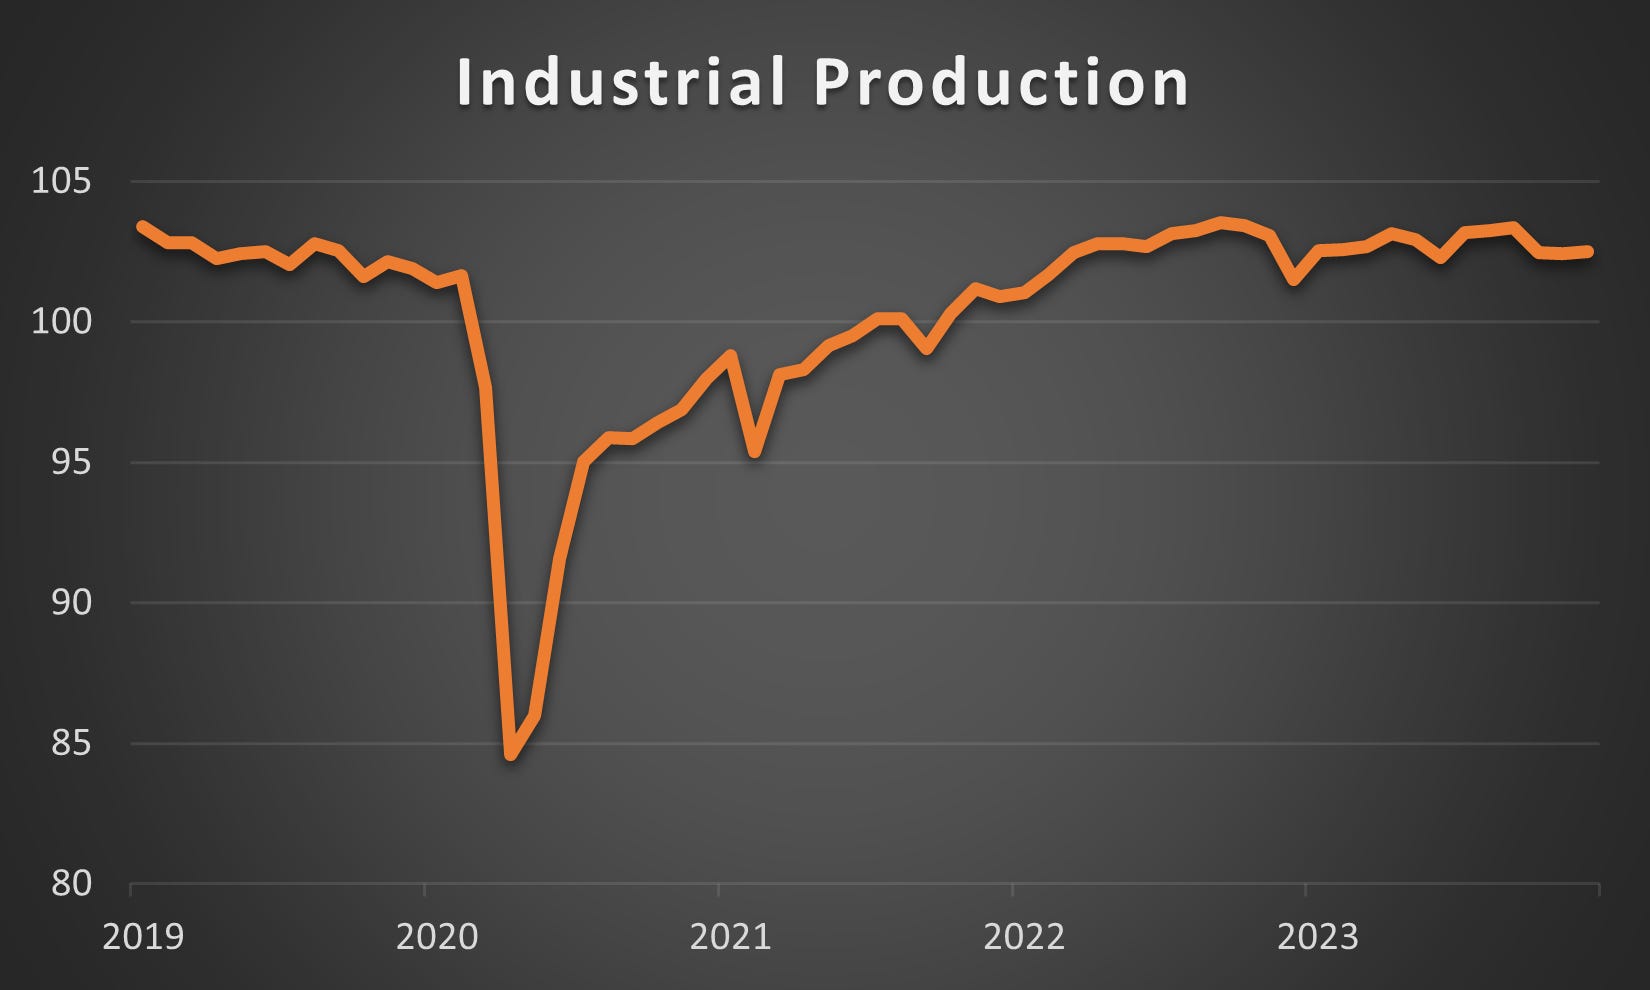
#2 Industrial production
Industrial Production is known for its high volatility in terms of trends, influenced by a multitude of factors such as strikes, weather conditions, production bottlenecks, inventory constraints, and abrupt spikes in the prices of industrial commodities or energy. While a downward trend in Industrial Production alone does not necessarily signal an impending recession, its combination with a declining employment trend is a strong indicator that the economy is likely already in a recession.
Industrial Production is an indexed figure and here is a bit more info about the index from Fed’s website: “The production index measures real output and is expressed as a percentage of real output in a base year, currently 2017. The capacity index, which is an estimate of sustainable potential output, is also expressed as a percentage of actual output in 2017. The production indexes are computed as Fisher indexes since 1972; the weights are based on annual estimates of value added. The rate of capacity utilization equals the seasonally adjusted output index expressed as a percentage of the related capacity index.”
https://www.federalreserve.gov/releases/g17/current/default.htm
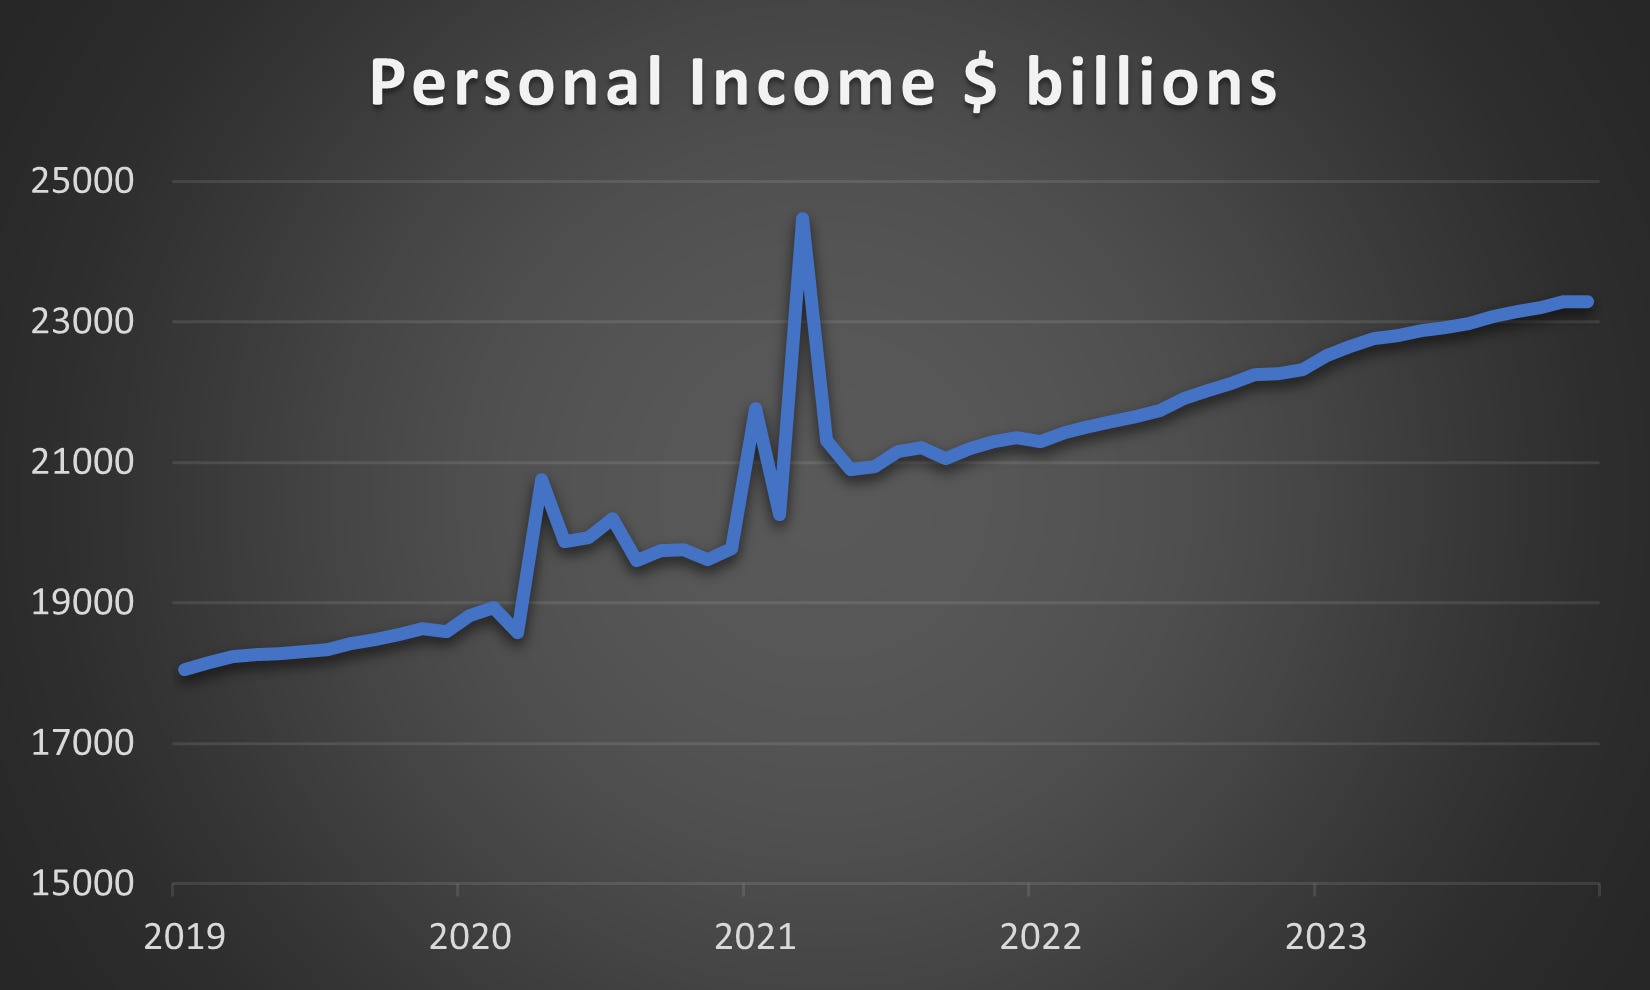
#3 Personal income
Personal income and personal consumption, with retail sales being my favored metric, typically trend in tandem. A noticeable decline in income trends is swiftly reflected in consumption patterns. When this is coupled with a slowdown in employment, a recession becomes unavoidable.
Personal income encompasses all earnings received by households, which includes wages, salaries, income from investments, rental income, and notably, transfer income such as government subsidies. The notable surges observed in the chart correspond to the government handouts distributed during the Covid period.
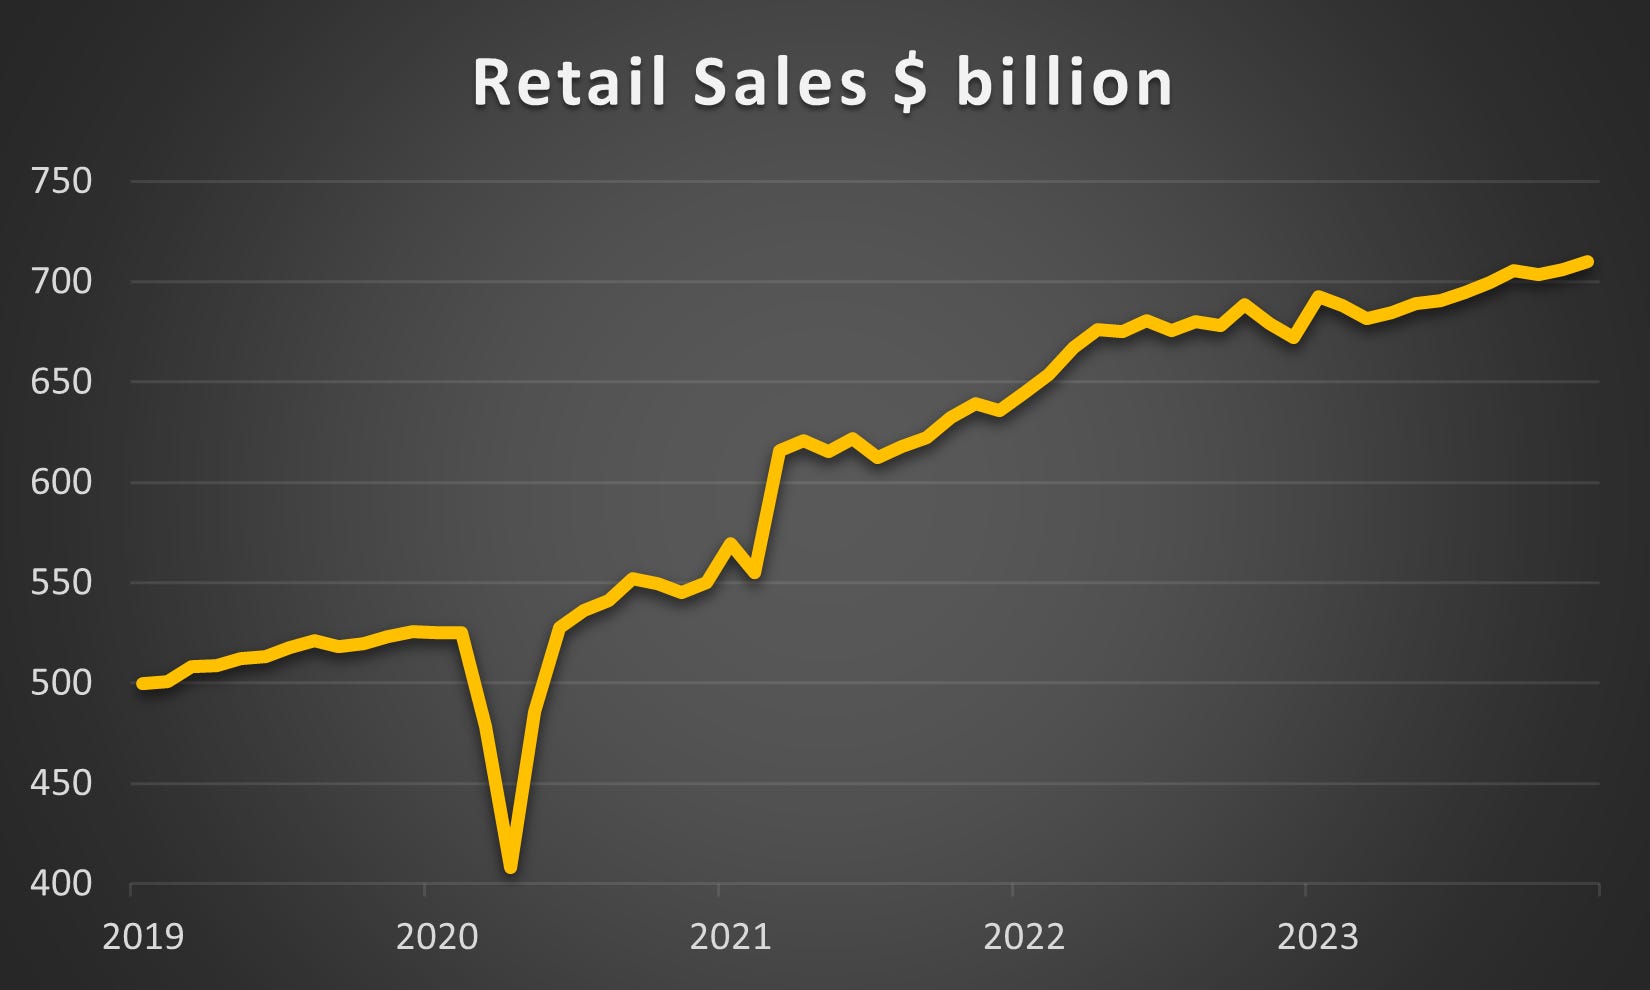
#4 Retail Sales
This dataset ranks as my second favorite, following employment data, as it vividly illustrates the strength and consumption propensity of U.S. consumers. It provides a monthly overview of the total nominal value of goods sold within the U.S. for personal or household use.
Here are the recession periods since 2000 as a reference:
Covid Recession:

Global Financial Crisis
Early 2000s recession
